Sciberia Head
0. About the Product
Sciberia Head is software for the automated analysis of medical images from computed tomography of the brain. The purpose of the processing is to detect signs of acute cerebrovascular disorders of the hemorrhagic type, with segmentation and determination of the volume of intracerebral hemorrhage (hereinafter referred to as the module).
When signs of acute cerebrovascular disorders are detected, data is provided on the severity of brain damage: quantitative characteristics of the volume of hemorrhage in cubic centimeters (cc) and localization of the pathology (left/right hemisphere).
Note
Sciberia Head is a clinical decision support system (CDSS).
0.1. Functionality
Main Features:
Can automatically process incoming CT images of the brain when installed on the servers of a medical organization [1].
Can send studies to the Sciberia Head cloud server using Sciberia Viewer.
Analyzes images and allows automation of processes for localization, segmentation, and classification of detected changes in the brain.
Generates Secondary Capture (processed study) with quantitative calculations of the hemorrhage volume in cubic centimeters (cc) and visual representation of brain areas with pathological patterns [2].
Generates a Structured Report with study characteristics and quantitative calculations in the presence of pathology [3].
Has a web interface for monitoring the module’s operation.
Can perform statistics on the results of the operation.
Can visualize statistical data.
0.2. System Requirements
Minimum System Requirements:
Without Graphics Accelerator |
With Graphics Accelerator |
|
|---|---|---|
Processor |
8 cores, 2.0 GHz clock speed |
8 cores, 2.0 GHz clock speed or higher |
RAM |
DDR4 16 GB |
DDR4 16 GB |
Graphics Accelerator |
Nvidia GPU 8 GB VRAM, RTX series or higher |
|
Operating System |
Debian kernel version 4.19 or higher |
Debian kernel version 4.19 or higher |
Application Containerizer |
Docker 19.0.3 or higher |
Docker 19.0.3 or higher |
1. Installation
Installation and access organization are carried out by the technical support team of Sciberia.
Installation on the server of a medical organization (MO) (server solution or installation at the user’s workstation).
Access to the operation is provided after module installation, during which the PACS server configuration with which the module will interact is specified.
Note
The result of Sciberia Head processing is a preliminary diagnosis and requires mandatory interpretation by a specialist.
2. Working with the Module
To access the module’s processing results at the physician’s workstation, any DICOM viewer
2.1. Module Installed on the Server
The module starts upon completion of installation and operates for the entire time that the server on which the module is installed is running and connected to the local network.
The module continuously monitors for new brain CT studies of suitable modality and performs their analysis and processing.
A monitoring screen for the module’s operation is available from any web browser application.
2.1.1. Automatic Processing of Studies
The Head module is constantly waiting for new CT studies for processing.
Studies are automatically sent for processing directly from the PACS server.
When a new CT study appears on the PACS server, the module prepares the CT images for processing, only processing DICOM images of CT modality that contain brain images.
Note
The module performs automatic processing of studies immediately after they are received on the PACS server.
2.1.2. Monitoring Sciberia Head
Viewing the module’s status and the queue of DICOM images for processing can be done from any web browser application located within the same network as the server or workstation with the Sciberia Head module installed, by adding the port number: 8080.
Module Status Window:
The table displays the queue of studies that have been processed, are in the processing stage, or have been sent for processing in the Sciberia Head module.
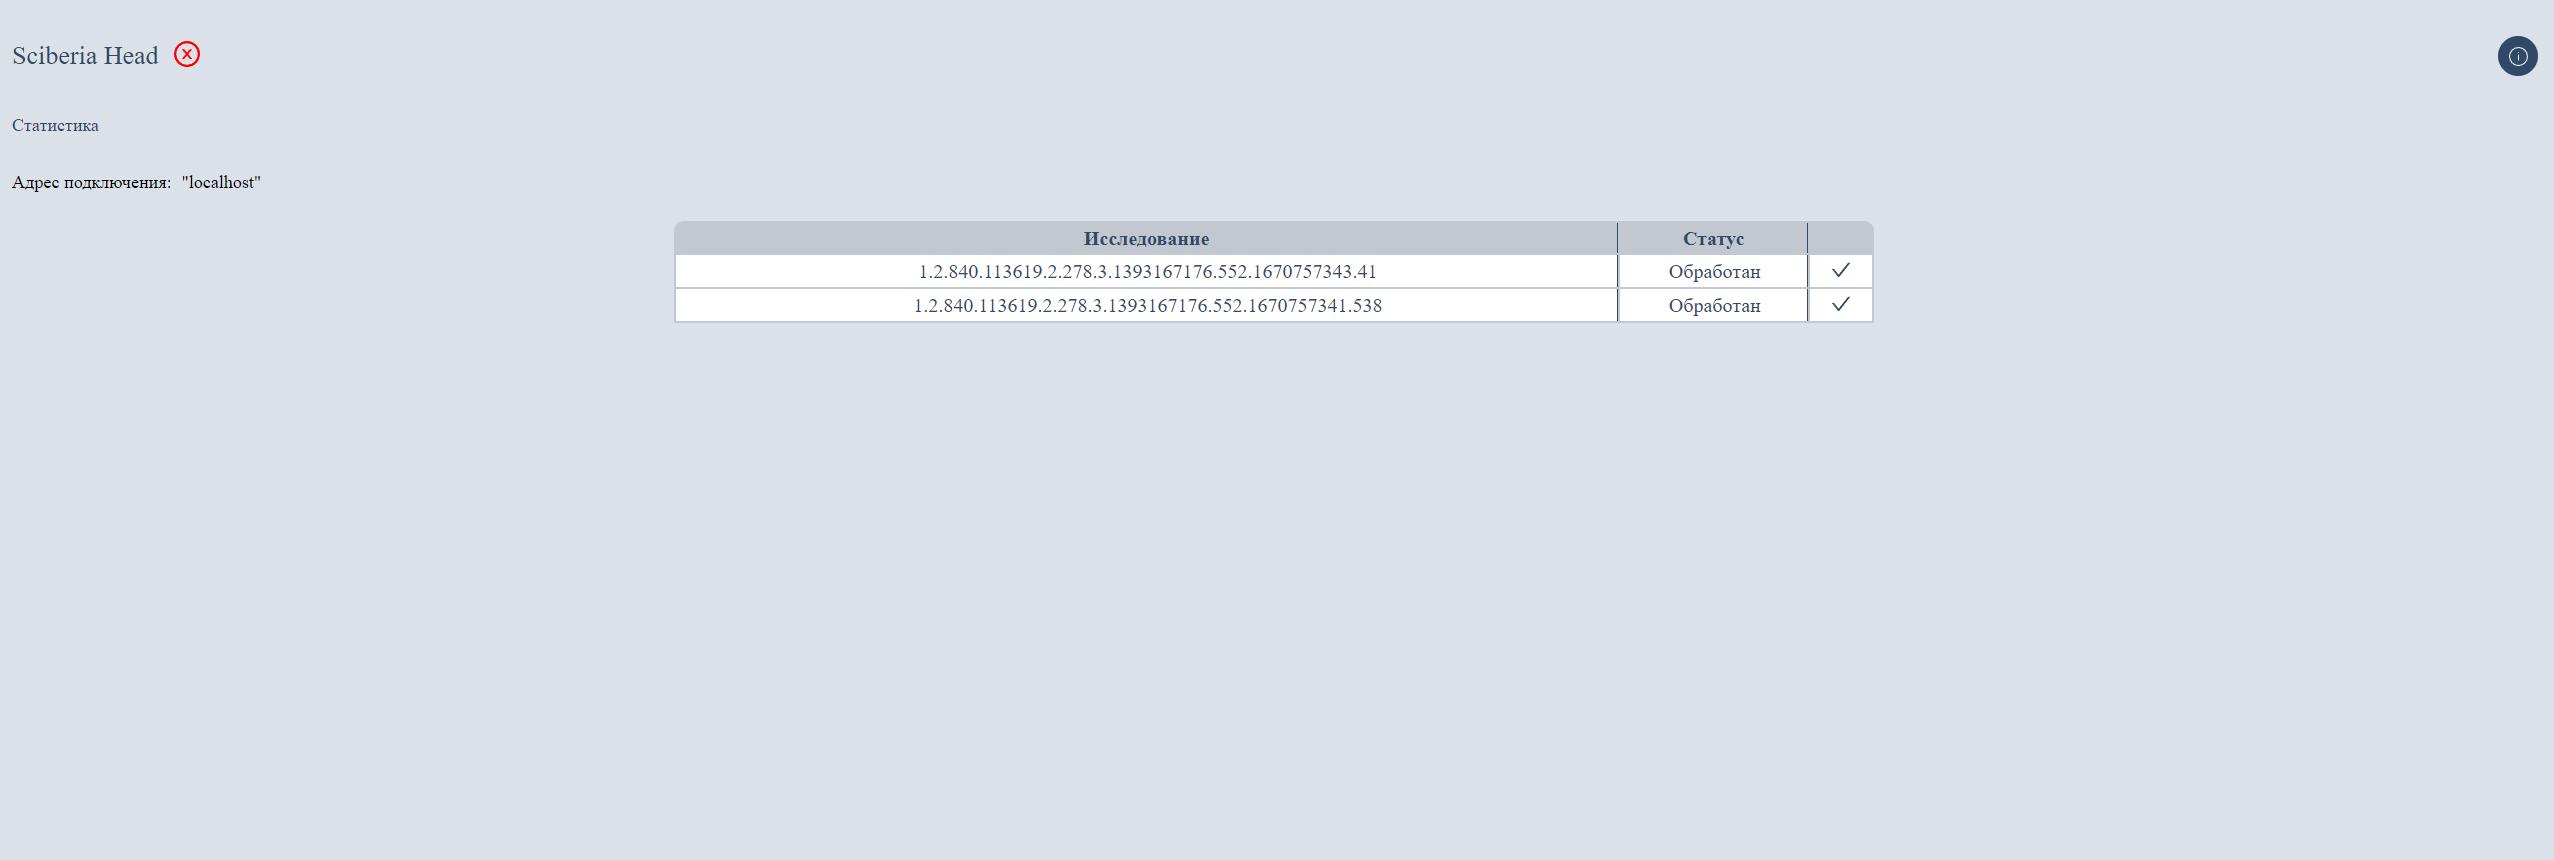
The table includes:
Column |
Description |
|---|---|
Study Identifier |
Identification number of the study. |
Status |
Status of the study in the queue: In Queue, Processing, Processed |
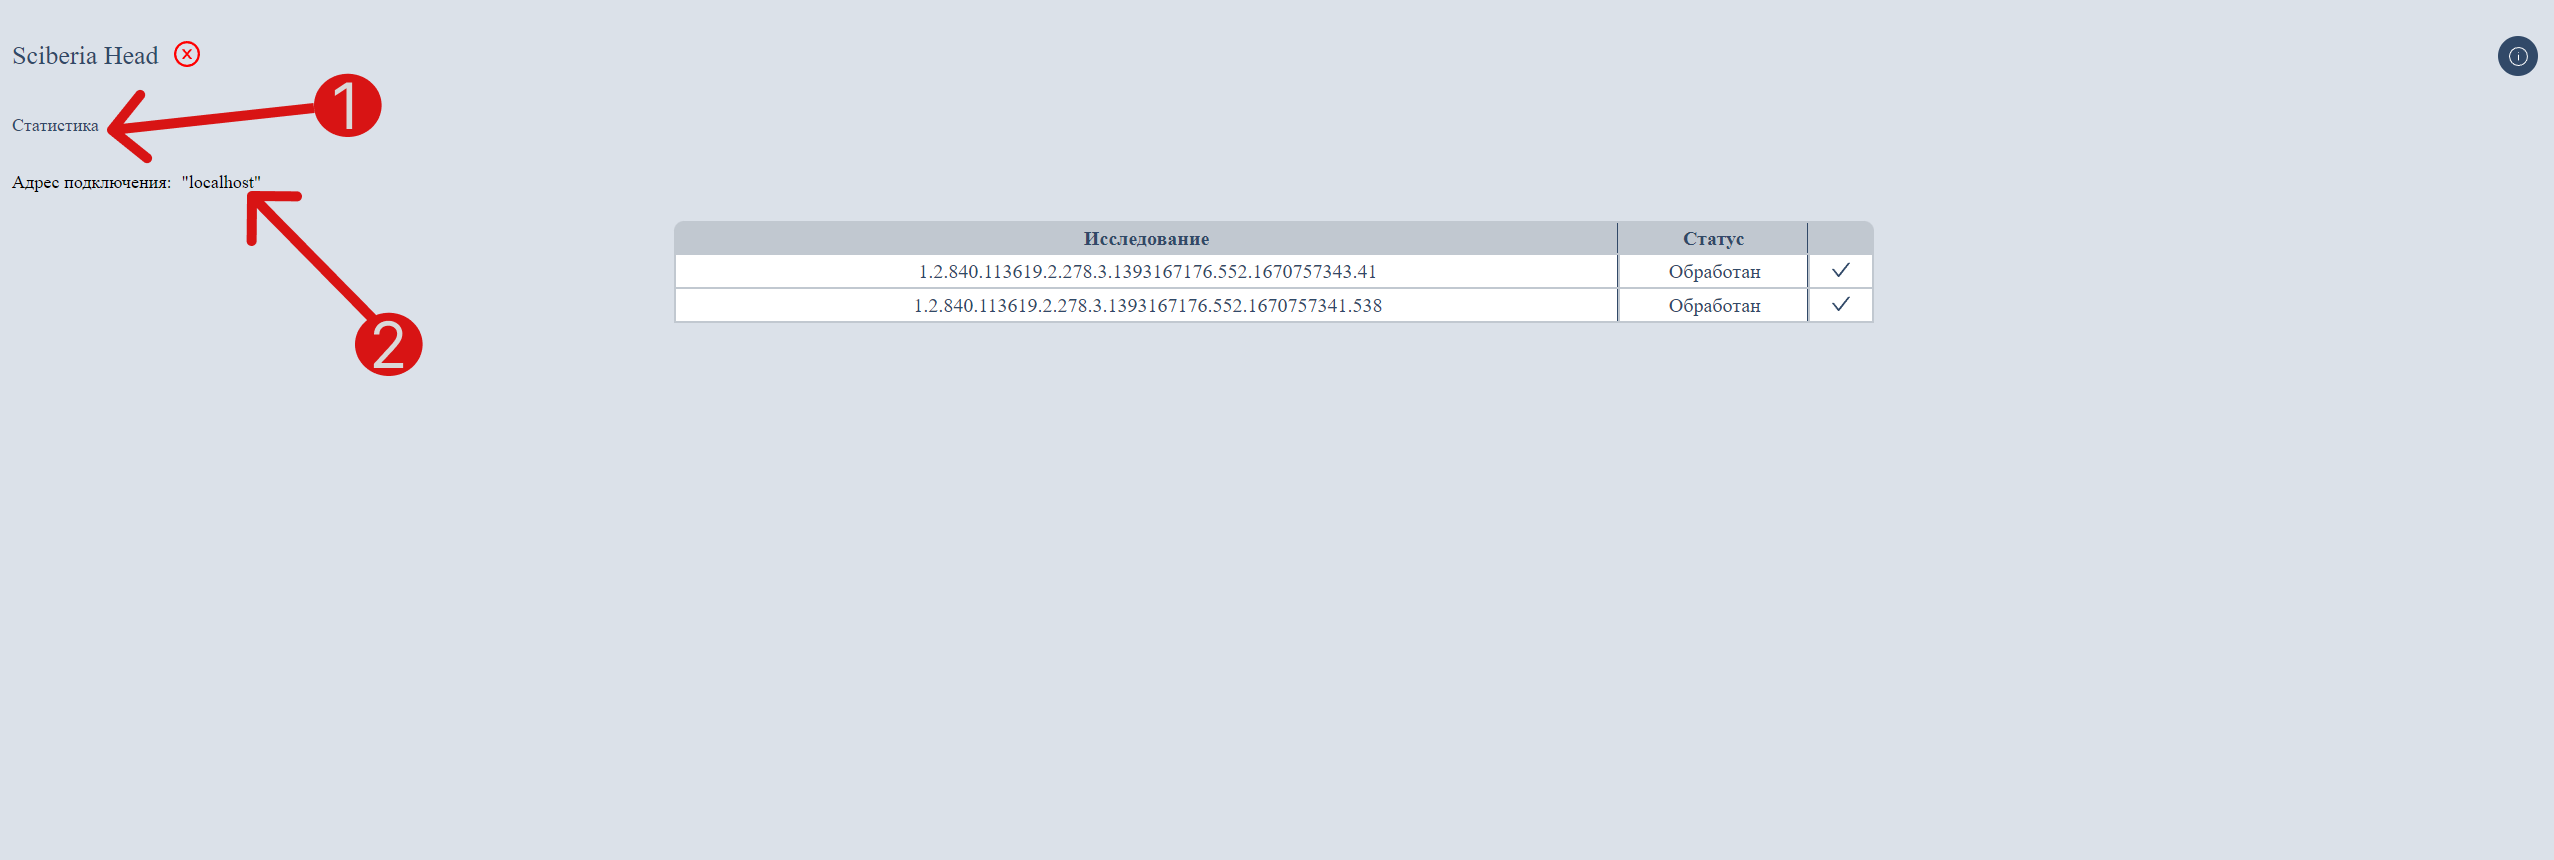
To open the module’s statistics window, click the Statistics button.
Displays the current connection Connection Address.
Module Statistics Window:

The table contains all studies that have been processed by the Sciberia Head module.
Total Number shows the total number of processed studies.
The table includes:
Column |
Description |
|---|---|
Study Identifier |
Identification number of the study. |
Status |
Status of the processed study. |
Lesion |
Volume of hemorrhage in cubic centimeters. |
Location |
Localization of the pathology: left hemisphere, right hemisphere. |
Processing Time |
Time of processing the study in seconds. |
Processing Start |
Date and time of processing start. |
Processing End |
Date and time of processing end. |
Statistics on the statuses of processed studies include a table (in both quantitative and percentage terms) and a visualization in the form of a chart.
Field |
Description |
|---|---|
Total |
Total number of processed studies. |
No Changes |
Number of studies with no changes. |
Presence of Pathologies |
Number of studies with pathologies. |
Not Brain |
Number of studies without brain images. |
Errors |
Number of studies with original errors. |
Note
Module monitoring is only available if the module is hosted on a medical organization’s server.
2.2. Access to the Module via API
Login and password for accessing the API, where the module is located, are provided by Sciberia.
2.2.1 Sending Studies for Processing using Sciberia Viewer
To send a study to the Sciberia Head processing module, select the desired study and click the «Send» button  .
.
The manual sending function for studies is available in the Sciberia Viewer program.
Important
Sciberia Viewer is software for viewing medical studies in DICOM format obtained from diagnostic equipment of various manufacturers. The software is available for an additional fee.
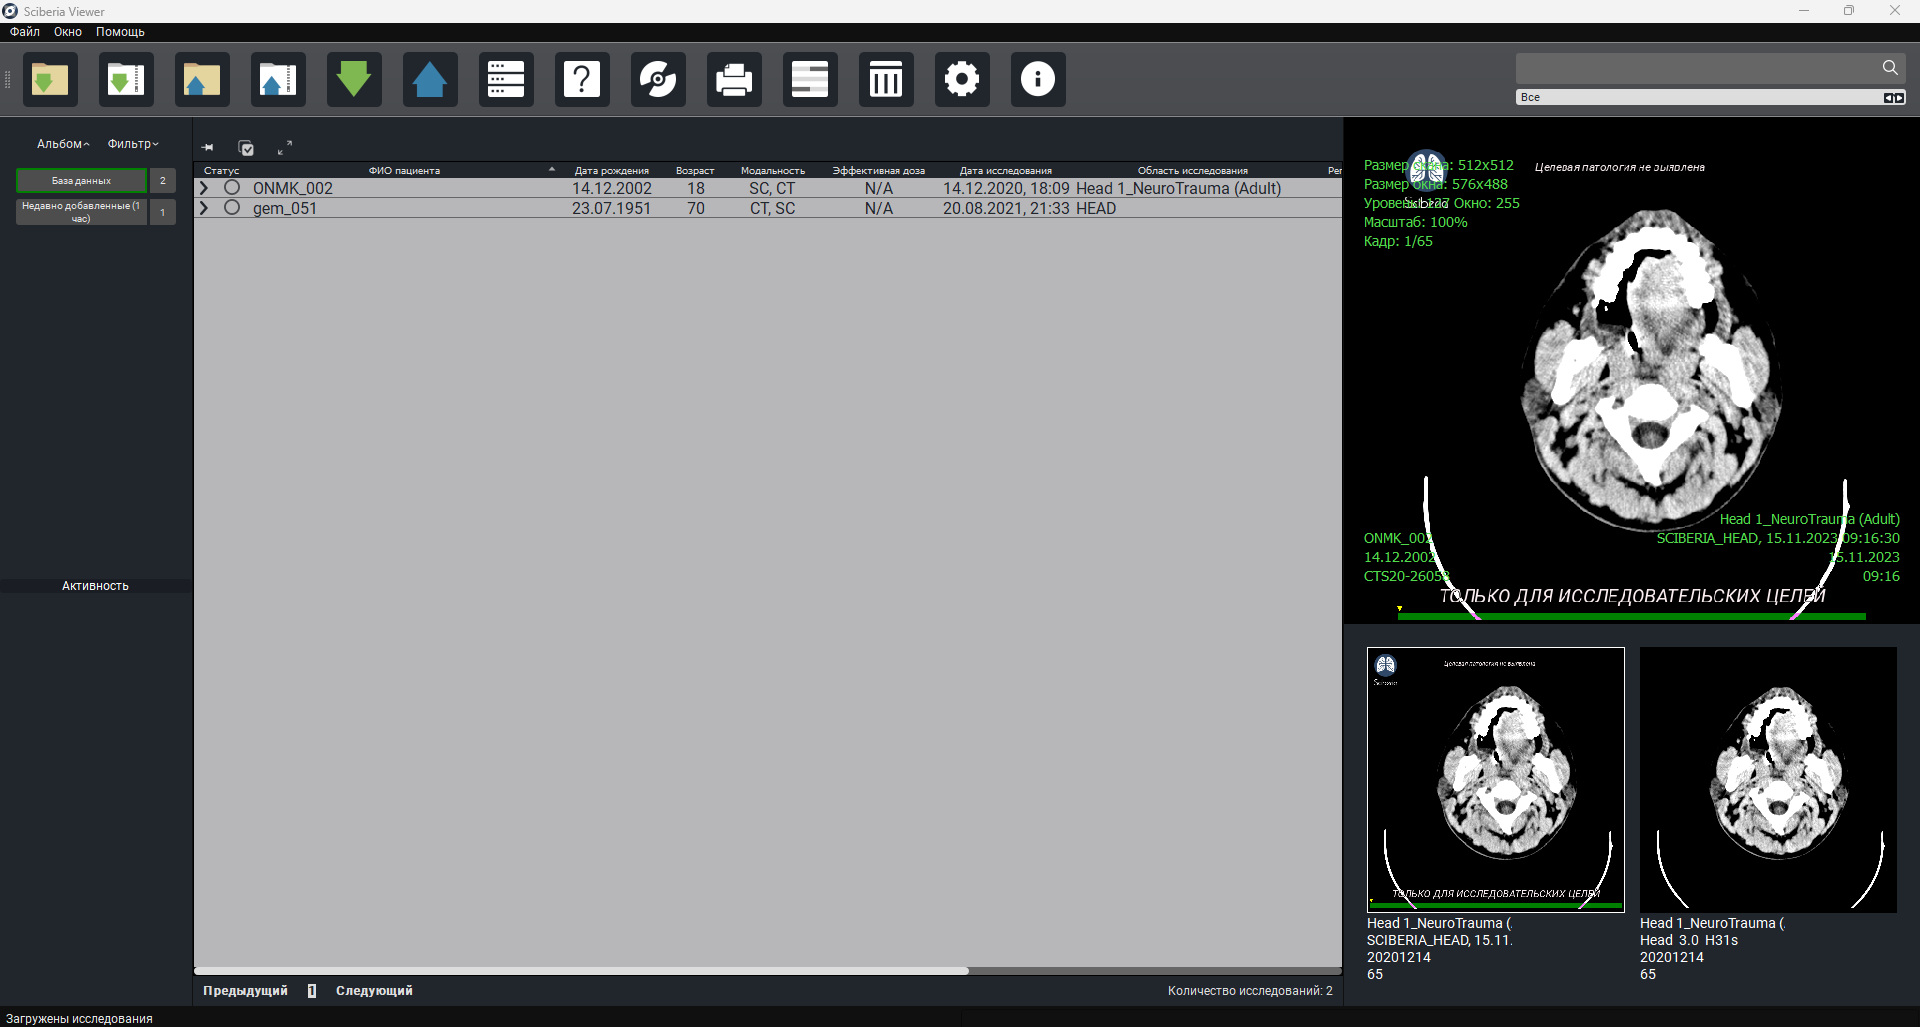
In the appeared window, select the required module for processing brain studies - «HEAD».
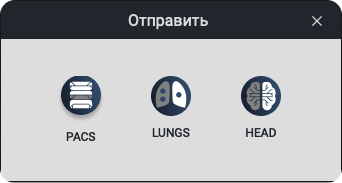
Clicking on «HEAD» will open the following window:
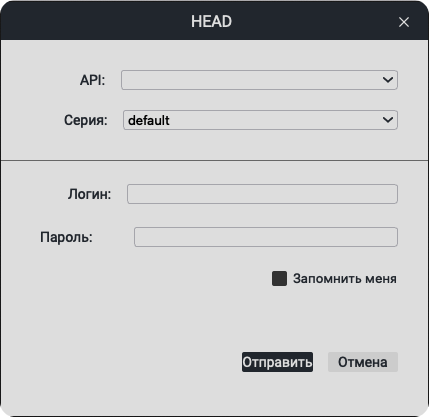
From the list, select the API and required series, enter the API login and password. You can check the box for «Remember Me». Click the «Send» button.
Note
In the Sciberia Viewer settings, you can configure the API connection parameters.
After processing, the same studies with additional annotations and quantitative characteristics are provided.
2.3. Processing Results
After processing, a copy of the original series with modality «SC» (Secondary Capture) is created in the local storage.
Note
Processed results are sent back to the PACS server, from which users
If the software detects pathological patterns, the following information is recorded on the Secondary Capture image (marked with corresponding numbers):
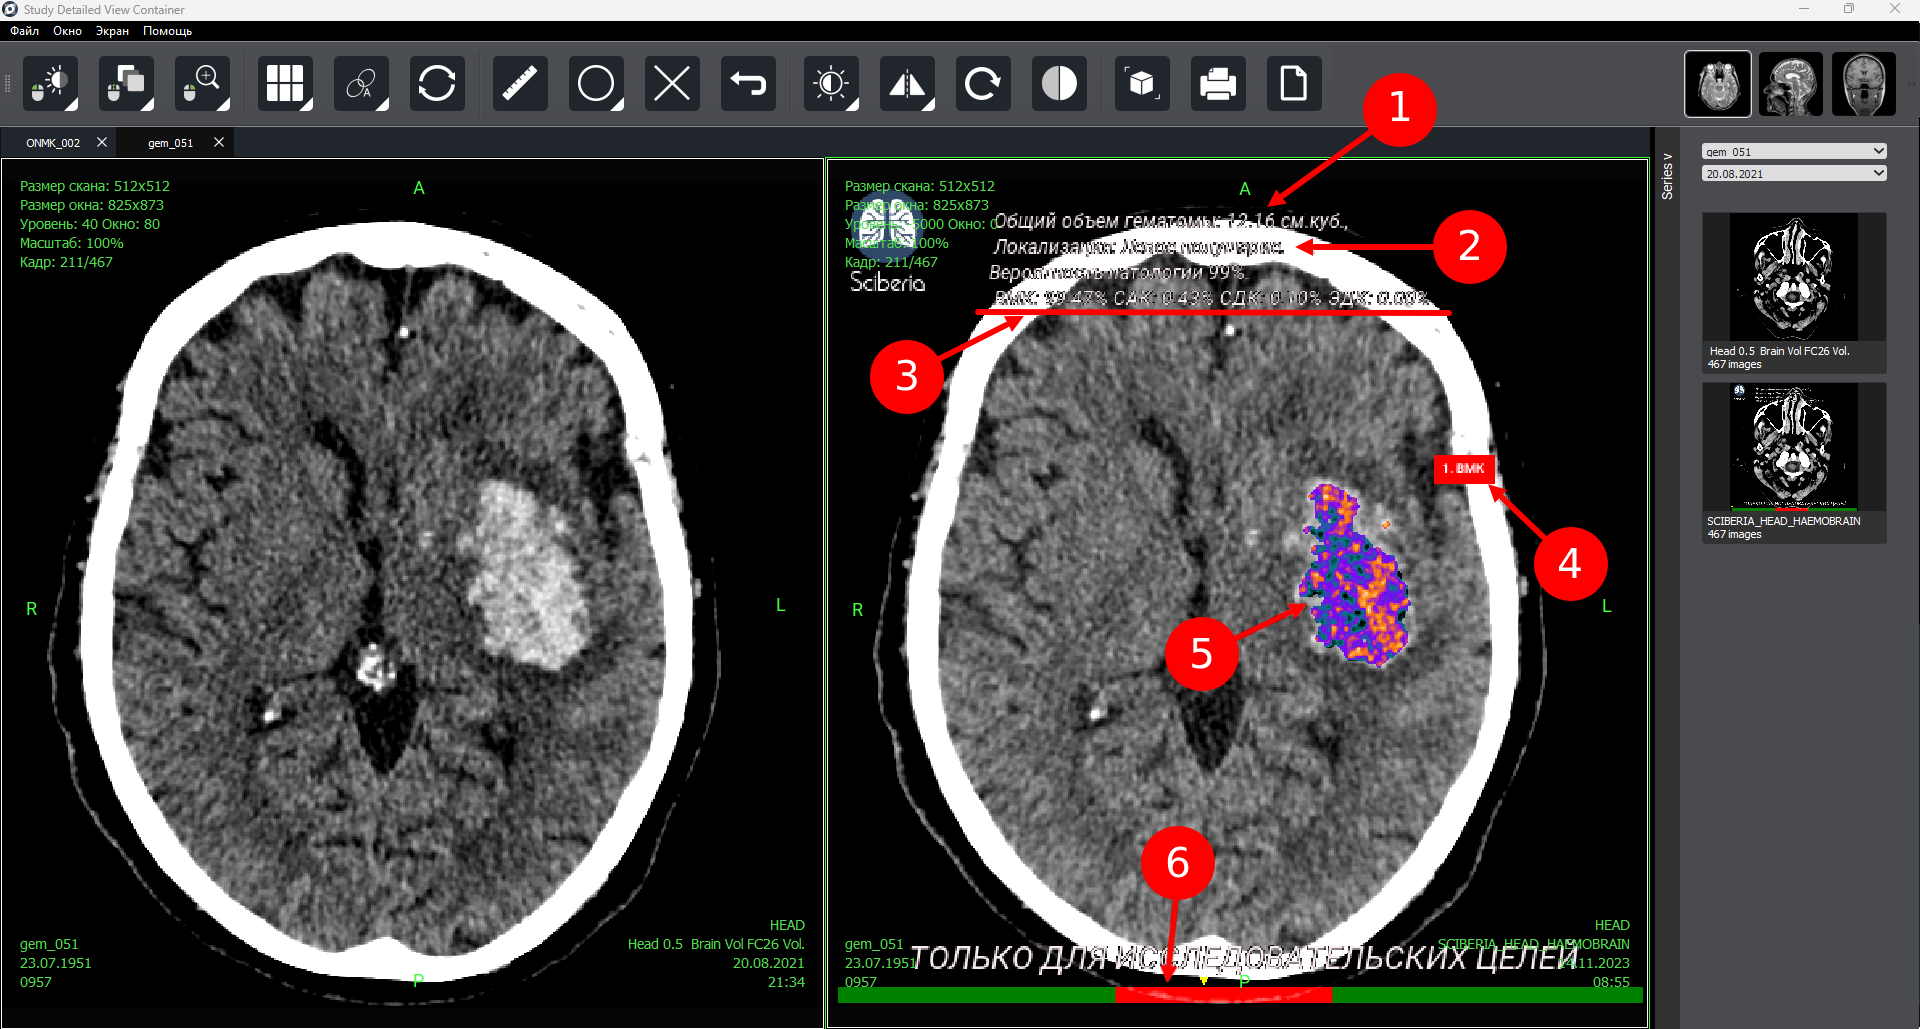
Number |
Description |
|---|---|
1 |
Total volume of hemorrhage (hematomas) determined by the module. |
2 |
Localization of the pathology: left hemisphere, right hemisphere. |
3 |
Probability in percentage: |
|
|
4 |
Probable type. |
5 |
Lesion areas highlighted in color according to the DICOM standard spectrum. |
6 |
Slice area with detected pathology. |
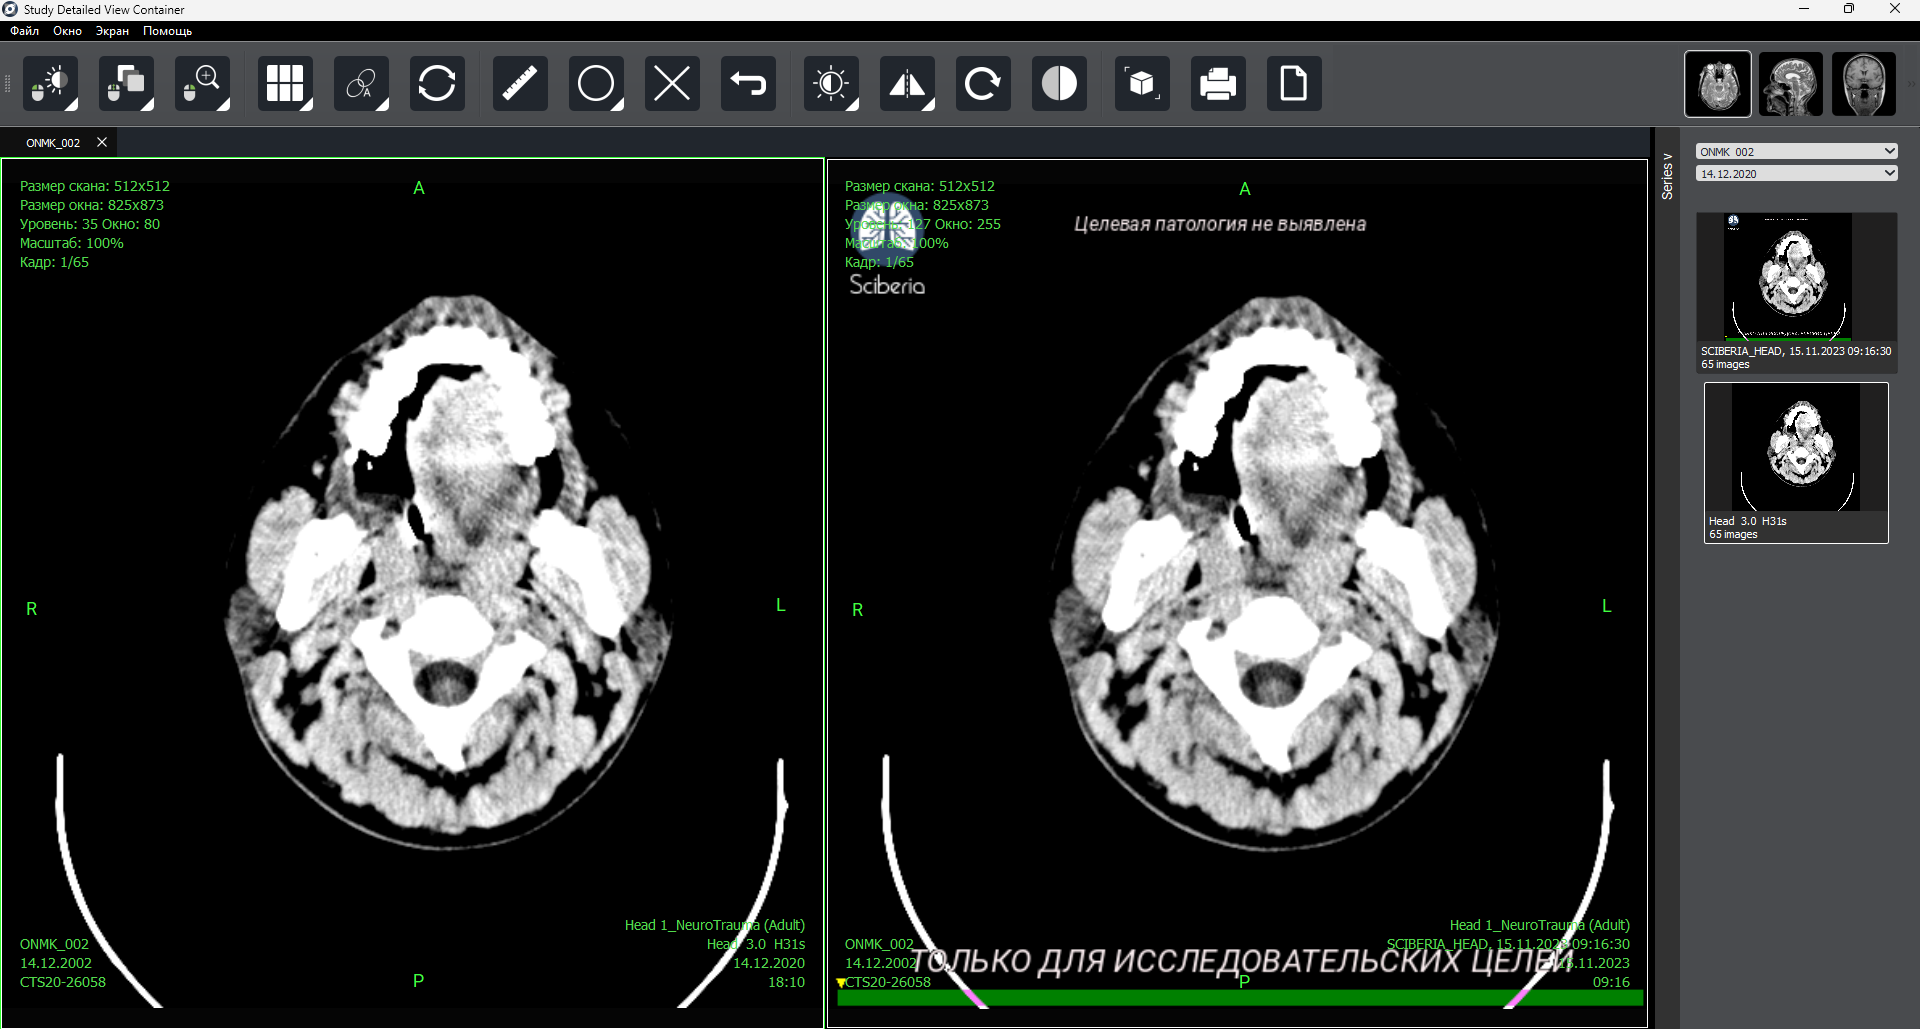
If the module does not detect pathological patterns, the following information is recorded on the Secondary Capture image:
Important
All images in the new series include a text message notifying of the mandatory interpretation by a specialist: «For Research Purposes Only».
3. Ending Module Operation
The module operates in a continuous, ‘background’ mode, so user operations to end the module’s work are not provided. Termination of the module’s work is only possible by shutting down the server on which the module is installed, uninstalling it, or disconnecting it by the system administrator of the medical organization.